In this article you will learn the various aspects of the Pin Bar Trading Strategy used during a Pin Bar momentum break. Some of these features include the conditions needed for a potential long or short entry consisting of a single price bar/candle and the optimum time to place a stop loss.
A breakdown of the results of back testing for EUR/USD, GBP/USD and USD/JPY during three different time frames–daily, 4 hour, and 1 hour–is also discussed in detail.
This is the 2nd article in the Momentum Trading Strategy series. The first one can be found here: Outside Bar Momentum Strategy.
STRATEGY #2 – PIN BAR MOMENTUM BREAK
Entry
A potential entry when using the Pin Bar Trading Strategy is identified from one single price bar/candle. The candle just needs to meet two conditions when it closes:
1. It must be a Pin Bar – this is a bar with an open and close that are both in either the top quarter of its range, or the bottom quarter of its range.
2. If the Pin Bar closes in the upper quarter of its range, its low must be lower than the low of the previous 4 candles. If the Pin Bar closes in the lower quarter of its range, its high must be higher than the high of the previous 4 candles.
If the bar closes in the upper quarter of its range, if we are using the Pin Bar Trading Strategy we are looking for itshigh to be exceeded by at least one pip by the very next bar, and at this price we enter long. However if the price trades below the low of the Pin Bar before this happens, the entry is not taken.
If the bar closes in the lower quarter of its range, we are looking for its low to be exceeded by at least one pip by thevery next bar, and at this price we enter short. However if the price trades above the high of the Pin Bar before this happens, the entry is not taken.
Examples of entries and stop loss placements in Pin Bar trading are shown below:
Long Entry:
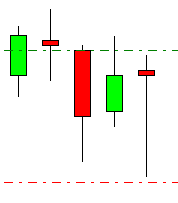
Note that both the open and the close are in the top quarter of the candle. The candle’s low is lower than the lows of all of the previous 4 candles.
The long entry order is shown by the dotted green line, 1 pip above the high of the candle that has just closed.
The stop loss is shown by the dotted red line, 1 pip below the low of the candle that has just closed.
The order must now be triggered by the next candle, before the red line is hit.
The long entry order is shown by the dotted green line, 1 pip above the high of the candle that has just closed.
The stop loss is shown by the dotted red line, 1 pip below the low of the candle that has just closed.
The order must now be triggered by the next candle, before the red line is hit.
Short Entry:
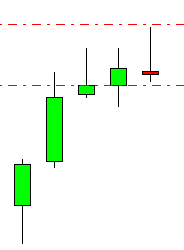
Note that both the open and the close are in the bottom quarter of the candle. The candle’s high is higher than the highs of all of the previous 4 candles.
The short entry order is shown by the dotted green line, 1 pip below the low of the candle that has just closed.
The stop loss is shown by the dotted red line, 1 pip above the high of the candle that has just closed.
The order must now be triggered by the next candle, before the red line is hit.
Stop Loss
The stop loss is simply placed one pip beyond the other side of the candle. If the trade is long, it is placed one pip below the low of the candle. If the trade is short, it is placed one pip above the high of the candle.
Regarding Profit Targets and Issues, the information given on Page 7 for Strategy #1 is also applicable here.
Pin Bar Trading Strategy Justification
A Pin Bar may indicate the sudden rejection, with momentum, of a particular price level or zone. It is therefore indicative of momentum and impulsiveness and possibly identifies that an S/R level or zone has been reached from which the price has been rejected.
The open close of the Outside Bar in either the top or bottom quartile, and the breaking of that quartile during the next bar before the other side is broken, are further indications of strong momentum in the direction of the trade.
The open close of the Outside Bar in either the top or bottom quartile, and the breaking of that quartile during the next bar before the other side is broken, are further indications of strong momentum in the direction of the trade.
STRATEGY #2 – PIN BAR MOMENTUM BREAK: BACK TEST RESULTS:
The testing was conducted on only the 1 hour and 4 hour time frames. The historical data used ran from 1st November 2003 to 30th October 2013.
London time was used and is given in the results. During half of the year, London time and GMT differ by 1 hour.
London time was used and is given in the results. During half of the year, London time and GMT differ by 1 hour.
Daily Time Frame
Signals were few and on this time frame are better considered strongly on their individual merits. For these reasons, no results are given here.
H4 Time Frame
The historical data used ran from 1st November 2003 to 31st October 2013.
The hypothetical results were as follows:
The hypothetical results seem to be disappointing. We have a fairly large sample of 661 trades overall and the winning percentage is just a shade above random.
Applying the “larger than the previous 5 candles” filter makes a significant difference to the hypothetical results of both the GBP/USD and USD/JPY pairs:
Although the sample sizes are small, the winning ratios are very high in the case of GBP/USD and nicely high in the case of USD/JPY. This is a rare trade, but historically has performed well over the past decade.
I find these results plausible as the filter helps to identify relative impulsiveness of new moves which tend to be reversals. The fact that the filter has the greatest impact on GBP/USD and the least impact on EUR/USD can be explained by the relative liquidities of the pairs, with the EUR/USD being prone to ranging behavior and the GBP/USD being prone to momentum behavior.
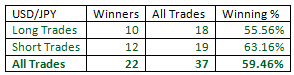
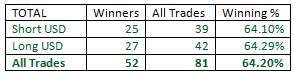
Applying the time of day filter is useful in highlighting a historically useful time in the USD/JPY pair only. Of the candles closing at 8am GMT, 63.16% produced hypothetical winning trades over the past decade, out of a total of 38 trades. I find this result plausible as it coincides with the final part of the Tokyo session and the opening of the London session which can provide the impetus for a move.
Taking all the highlighted trades on the H4 timeframe in total, this would have produced a positive hypothetical expectancy of 28.40% per trade.
An average of about 8 trades was triggered per year, about 0.67 per month.
H1 Time Frame
The historical data used ran from 1st November 2003 to 31st October 2013.
The hypothetical results were as follows:
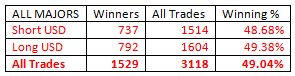
The hypothetical results seem to be disappointing. We have a very large sample of 3118 trades overall and the winning percentage is effectively random.
Let’s take each pair and see if their respective hypothetical results can be improved by filters:
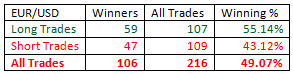
EUR/USD
After applying the time of day filter, the only hypothetical result worth highlighting came from the 56 trades that were triggered between 2am and 3am London time, coinciding with the Tokyo open. 58.93% of these trades were winners. I do not see this as a meaningful result as there is nothing significant happening at this time.
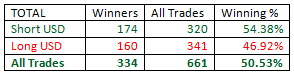
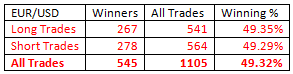
By applying the “larger than previous 5 candles” filter over all the trades regardless of time of day, it was possible to secure a significant hypothetical result:
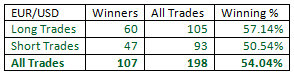
The significant gap between the long and short trades is concerning, so this should be refined further. The results for the London session as a whole bring the winning percentage to just a few points over the 55% cut off, but it is the results for the time period covering the London / New York session overlap (between 1pm and 5pm London time, typically the time of greatest market liquidity) that are really impressive and roughly equal between long and short trades.
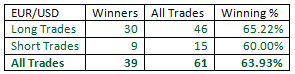
This is a plausible result due to the high liquidity and volume usually present during the London / New York session overlaps.
It should also be noted that with a much larger sample size, all the trades taken during the London session excluding its first hour (i.e. from 9am to 5pm London time) produced the following hypothetical result with an almost identical winning percentage:
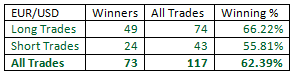
This could be a plausible result. However, as can be seen, the gap between long and short trades is huge, so I do not find it reliable.
The London / New York overlap trade looks the most solid here.
The London / New York overlap trade looks the most solid here.
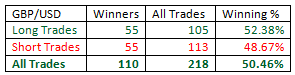
GBP/USD
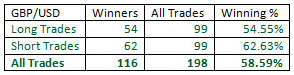
After applying the time of day filter, the only hypothetical result worth highlighting came from the 75 trades that were triggered between 8am and 9am London time, coinciding with the London open. 62.67% of these trades were winners. This is a significant result as it coincides with the beginning of the most important session in which this pair is traded.
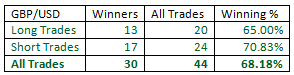
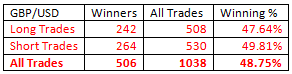
By applying the “larger than previous 5 candles” filter over all the trades regardless of time of day, it was possible to secure a significant hypothetical result:
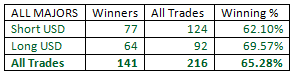
The hypothetical result above can be filtered effectively and logically by restricting entry times to between 8am and 5pm London time, improving the winning rates of both long and short trades as shown in the hypothetical results below:
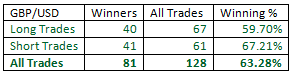
These are significant results as the filters identify momentum and impulsiveness and restrict trades to the predominant London session.
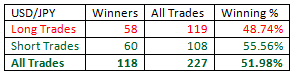
USD/JPY
Applying the time of day filter, at least on its own, made no difference.
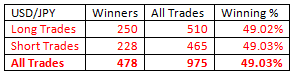
By applying the “larger than previous 5 candles” filter over all the trades regardless of time of day, it was possible to secure a significant hypothetical result:
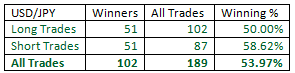
This is not good enough to be of interest. However, combining this filter with trading only between 3pm and 5pm London time during part of the London / New York session overlap produced an excellent win rate, but a very small sample size:
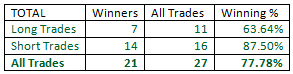
Taking all the highlighted trades on the H1 timeframe in total, this would have produced a positive hypothetical expectancy of 30.56% per trade.
An average of about 22 trades was triggered per year, just under 1.9 per month.
I do not consider this to be a significant result as there is nothing significant about these particular two hours of the London session, despite their being part of the London / New York sessions overlap.
TIME MAP OF HISTORICALLY PROFITABLE TRADES USING STRATEGIES #1 / #2*
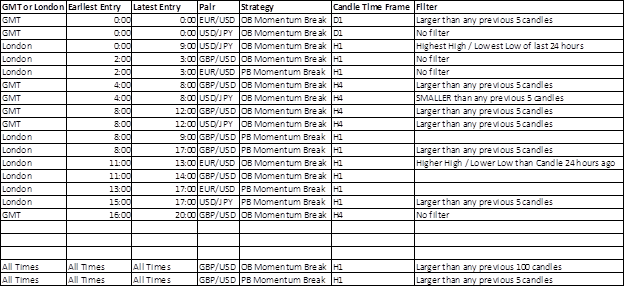
* Strategy #1 refers to the first article in the Momentum Trading Strategies seriese that tests the Outside Bar Trading Strategy. Click here to read it.
Overall, the results show that volatility and time of day are important factors in determining market movement predictability after candlestick patterns.
Kewords: Forex Currency Trading, Forex Forecast, Forex Learn Trading, Forex Mini, Forex Mini Account, Forex Mini Trading, Forex Trading, Forex Trading Platform, Forex Trading Software, Forex Market, Forex Strategy, Forex Signal, Forex Forum, Forex News, chicbull.com
No comments:
Post a Comment